Presentation made with Canva, click on the image below to access Executive Summary or see it on Canva.
Introduction
This is my version of the analysis of the “Coffee quality” datasets by James LeDoux. The datasets are available here.
Data dictionary in appendix.
The global coffee bean market value was US $107. 93 billion in 2021 and it is expected to reach US $167. 51 billion by 2027 (ReportLinker, 2022). The positive outlook is boosted by growing consumer demand and consumers’ interest in new flavors. This dataset covers the years 2009 to 2018. We, therefore, provide insights about the recent coffee market, and we can verify the accuracy of model predictions.
This type of analysis can be applied to a variety of different industries and products and can reveal important patterns and trends in customer behavior.
Notes about the dataset.
Two datasets are provided, one for the Arabica beans and one for the Robusta beans. Good coffee requires a balanced mix of these two species (SpecialCoffee, 2018); however, the two datasets cannot be properly merged because the variables are different. Also, the Robusta dataset contains a small number of observations – less than 30 – compared to more than 1300 observations in the Arabica dataset. Therefore, I restrict attention to the Arabica dataset. Here is a snapshot of the variables, together with the percentage of missing values for each variable:

There are 1311 observations and 43 variables. Data cleaning was required – e.g., to remove the “Lot.Number” variable since it has too many missing values. Some values were also evidently incorrect in the “altitude_mean_meters” variable. Exploratory data analysis (EDA) was particularly useful also for later determining the model approach or estimating how balance, acidity, aroma, and aftertaste contribute to perfect flavor. The data analysis determined the relationship between “Total.Cup.Points” – the final grade the coffee cup has received – and variables including the place of production, the production method, the variety of coffee beans, and the color of coffee beans. Total.Cup.Points runs from 0 to 100, and represents a standard metric for coffee reviews. According to the Coffeereview website (n.d.), coffee ratings higher than 97 equal the best cups, while ratings of 85/86 are “barely acceptable.”
Coffee Altitude
This plot relates the altitude at which coffee is harvested to the ratings (cup_points) the coffee received.
altitude_points <- coffees_altitude %>%
  ggplot(aes(altitude_mean_meters, cup_points)) +
  geom_point(aes(color=cup_points), size = 4) +
  ggtitle("Altitude Mean Meters compared to Average Cup Points")+
  theme_gray()+
theme(axis.text.x = element_text(angle = 45, vjust = 1, hjust=1))
altitude_points
There appears to be a slight inverted-U relationship. Most of the coffee with the highest scores – more than 85 cup-points – is made from beans grown at around 2000 meters. Almost all of the coffee made with beans grown at altitudes under 1500 meters or above 2500 meters had cup points below 85.
Coffee Variety and Total.Cup.Points
Variety vs. Total.Cup.Points – most values are higher than 75, and there is an obvious outlier (at 0, likely an error) in the Caturra Variety; therefore, I filter values greater than 75.
l <- ggplot(data=arabica_clean, aes(x= Variety, y= Total.Cup.Points, color = Variety)) +
  geom_boxplot()+
  theme(axis.text.x = element_text(angle = 45, vjust = 1, hjust=1))
l
p <- arabica_clean %>%
  select(Variety, Total.Cup.Points) %>%
  filter(Total.Cup.Points > 75)
p


#Check boxplots, and here we see that some varieties stand out in terms of total cup points
ggplot(p, aes(x= Variety, y= Total.Cup.Points, color = Variety)) +
  geom_boxplot()+
  theme(axis.text.x = element_text(angle = 45, vjust = 1, hjust=1))
Total.Cup.Points (quality rating 0-100) represents a standard metric for coffee reviews. According to the Coffeereview website (n.d.), coffee ratings higher than 97 equal the best cups, while ratings of 85/86 are barely acceptable.
The following barplot shows that a few coffee varieties stand out, especially the Ethiopian Yirgacheffe variety.

#To make things easier, I rename the dataset
arab_coffee <- arabica_clean
Correlations
Next, I examine the bivariate correlations among the variables in the dataset:
df <- dplyr::select_if(arab_coffee, is.numeric)

#Calculate the correlations
r <- cor(df, use="complete.obs")
round(r,2)

ggcorrplot(r)
We see that Total.Cup.Points is positively correlated with a number of variables, including aroma, flavor, aftertaste acidity, body, balance, and sweetness.
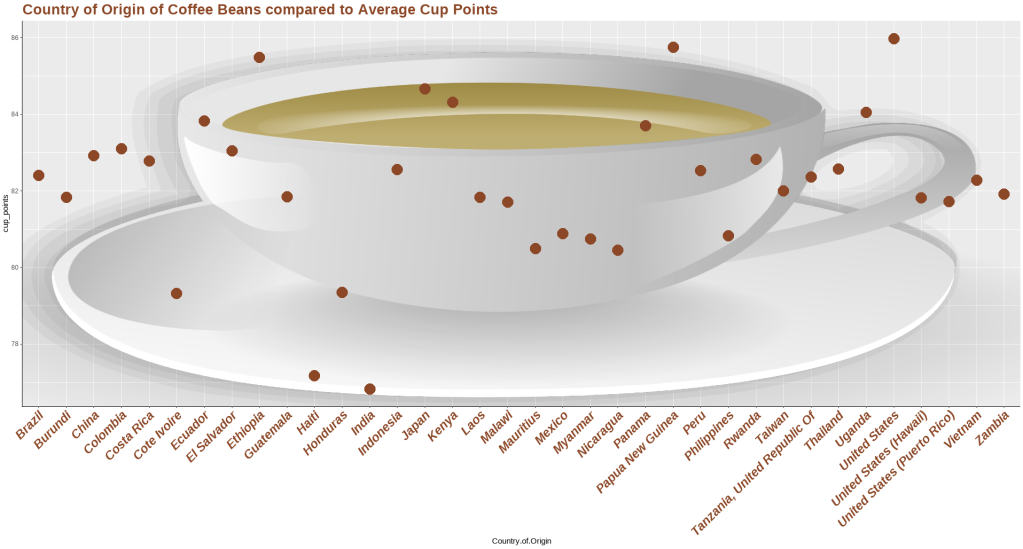
Coffee ratings and country of production
coffee_points <- coffees_reduced %>%
  ggplot(aes(Country.of.Origin, cup_points)) +
  geom_point(aes(color=cup_points), size = 4) +
  ggtitle("Country of Origin compared to Average Cup Points")+
  theme_gray()+
  theme(axis.text.x = element_text(angle = 45, vjust = 1, hjust=1, size = 15))
coffee_points
Coffee beans produced in Etiopia, Ecuador, Japan, Panama, Papua New Guinea, United States, Kenya, Panama, and Uganda have the highest ratings. I did not know that Japan produces one of the best coffees in the world (Taylor, 2020).
Country Partners and ratings
The Coffee Quality Institute notes that In-Country Partners “manage all coffee sample evaluations and corresponding invoices, assign Q Graders to samples, and finalize each certificate/report” (Coffee Quality Institute, n.d.).
The country partners with the highest coffee cup ratings are METAD Agricultural Development plc, Ethiopia Commodity Exchange, and Specialty Coffee Institute for Asia.
coffees_partners <- arab_coffee %>%
  select(In.Country.Partner, Total.Cup.Points) %>%
  group_by(In.Country.Partner) %>%
  summarise(cup_points = mean(Total.Cup.Points)) %>%
  print(n=37) %>%
  arrange(cup_points)

partners_points <- coffees_partners %>%
  ggplot(aes(cup_points, In.Country.Partner)) +
  geom_point(aes(color=cup_points), size = 4) +
  ggtitle("In Country Partners compared to Average Cup Points")+
  theme_gray()+
  theme(axis.text.y = element_text(vjust = 1, hjust= 1, face = "bold", size = 12))
partners_points

Coffee beans color
Ratings of coffee cups produced using blue-green and bluish-green beans seem slightly better than green ones.
coffees_color <- arab_coffee %>%
  select(Color, Total.Cup.Points) %>%
  group_by(Color) %>%
  summarise(cup_points = mean(Total.Cup.Points)) %>%
  arrange(cup_points)
coffees_color <- na.omit(coffees_color)

color_points <- coffees_color %>%
  ggplot(aes(Color, cup_points)) +
  geom_point(aes(color=cup_points), size = 4) +
  ggtitle("Coffee Beans Color compared to Average Cup Points")+
  theme_gray()+
theme(axis.text.x = element_text(angle = 45, vjust = 1, hjust=1))
color_points
Processing methods
Processing method and coffee cup points; the “pulped natural/honey” method seems slightly better than the others.
coffees_method <- na.omit(coffees_method) #remove NAs
coffees_method <- arab_coffee %>%
  select(Processing.Method, Total.Cup.Points) %>%
  group_by(Processing.Method) %>%
  summarise(cup_points = mean(Total.Cup.Points)) %>%
  arrange(cup_points)
coffees_method


method_points <- coffees_method %>%
  ggplot(aes(Processing.Method, cup_points)) +
  geom_point(aes(color=cup_points), size = 4) +
  ggtitle("Processing Method compared to Average Cup Points")+
  theme_gray()+
theme(axis.text.x = element_text(angle = 45, vjust = 1, hjust=1))
method_points
Number of Bags
The average amount of coffee bags tested is below 300 (with a few exceptions of around 600 and more than 900 bags). There is no clear relation between the number of bags tested and cup points.
coffees_bags <- arab_coffee %>%
  select(Number.of.Bags, Total.Cup.Points) %>%
  group_by(Number.of.Bags) %>%
  summarise(cup_points = mean(Total.Cup.Points)) %>%
  arrange(cup_points)
coffees_bags

bags_points <- coffees_bags %>%
  ggplot(aes(Number.of.Bags, cup_points)) +
  geom_point(aes(color=cup_points), size = 4) +
  ggtitle("Number of Bags produced compared to Average Cup Points")+
  theme_gray()+
  theme(axis.text.x = element_text(angle = 45, vjust = 1, hjust=1))
bags_points

Models
Rather than predicting cup points here I want to see which variables predict flavor. I do this because flavor and cup points are highly correlated and to me, coffee drinkers are looking for flavor (together with caffeine?).
set.seed(74)
sample(c("Aroma", "Flavor", "Aftertaste", "Acidity", "Body", "Balance","Cupper_Points"),
       size = 1)
[1] "Flavor"
Load tidymodels package and split the dataset using train/test functions to avoid overfitting. This problem might occur after using the same dataset to make predictions; a model is accurate when the error rate is low (Theobald, 2017 p. 48).
arab_coffee <- arab_coffee %>% #to give missing values factor level
  mutate(
Variety = fct_explicit_na(Variety),
    across(where(is.character), factor))
Theobald recommends splittings of 70/30 or 80/20, also considering the size of the dataset; so here I choose 75/25 (2017, p. 46).
set.seed(42)
coffee_split <- initial_split(arab_coffee, prop = 3/4, strata = Flavor)
coffee_train <- training(coffee_split)
coffee_test <- testing(coffee_split)

#In Tidymodels the vfold_cv splits data into V equal groups
coffee_resamples <- vfold_cv(coffee_train, v = 5, strata = Flavor)
Recipe.
In Tidymodels, recipes are used for feature engineering, to prepare data before using (Silge & Kuhn, 2022, chapter 8). I use “Flavor” as per the previous sample.
coffee_rec <-
  recipe(
   Flavor ~
      Country.of.Origin + Processing.Method + Color +
      In.Country.Partner + Variety + Aroma + Aftertaste + Acidity + Body +
      Balance + Uniformity + Clean.Cup + Sweetness + Moisture +
      altitude_mean_meters,
    data = coffee_train
  ) %>%
  step_impute_mode(all_nominal_predictors()) %>%
  step_other(Country.of.Origin, Variety, In.Country.Partner, Processing.Method,
             threshold = 0.05) %>%
  step_impute_mean(altitude_mean_meters) %>%
  step_normalize(all_numeric_predictors()) %>% #normalize variables
  step_ns(altitude_mean_meters, deg_free = 4) %>%
  step_dummy(all_nominal_predictors())
coffee_rec
#(Dunn, 2020)
Use prep to explore the processing and to apply the preprocessing to the datasets (Silge & Kuhn, 2022, chapter 16.4).
coffee_baked <- bake(prep(coffee_rec), new_data = NULL)
coffee_baked %>% paged_table()
Use DoParallel to register the execution of R code.
n_cores <- parallel::detectCores(logical = FALSE)
cl <- makePSOCKcluster(n_cores - 1)
registerDoParallel(cl)
I will apply three different models.
Linear Regression
lm_spec <- linear_reg() %>% #Linear Regression Model Specification (regression)
  set_engine("lm") #R uses the lm() function to create a regression model

lm_workflow <- workflow() %>% #regroup the major pieces of the modeling process
  add_recipe(coffee_rec) %>% #specifies the model terms and which preprocessing is required
  add_model(lm_spec)

#fit implies two steps, the preprocessing and fitting the model
lm_fit_train <- lm_workflow %>% #Pass lm_workflow into the fit function and save it as lm_fit_train
  fit(data = coffee_train)

#this step after the best model has been identified
lm_fit <- last_fit(lm_fit_train, coffee_split) #fit model to the entire training set and evaluate

collect_metrics(lm_fit) #check how the model performed


# A tibble: 2 × 4
  .metric .estimator .estimate .config
  <chr>   <chr>          <dbl> <chr>
1 rmse    standard       0.183 Preprocessor1_Model1
2 rsq     standard       0.756 Preprocessor1_Model1
Prediction versus actual data.
collect_predictions(lm_fit) %>% #collect summarized values
  ggplot(aes(x = Flavor, y = .pred)) +
  geom_point(color = "brown", alpha = 0.5) +
  geom_abline(slope = 1, intercept = 0, size = 1.5)
Linear regression results are encouraging.
Random Forest
Random forest ensemble learning combines the output of models to create a prediction method (Theobald, 2017, p. 115).
#Set mode and engine, then workflow as I did in the previous model.
#mtry is one of rand_forest main arguments (the others are trees and min_n), used for sampled predictors in each tree
#mtry = tune when cannot tell the precise number of predictors
#min_n, sets the minimum n (data points) required to split in a tree-based model
#trees(), the number of trees contained in a random forest or boosted ensemble.

ranger_spec <- rand_forest(mtry = tune(), min_n = tune(), trees = 1000) %>%
  set_mode("regression") %>%
  set_engine("ranger", importance = "permutation")

ranger_workflow <- workflow() %>%
  add_recipe(coffee_rec) %>%
  add_model(ranger_spec)

set.seed(12)
#tic toc functions from tictoc package, to nest and timing my function.
tic()
ranger_tune <-
tune_grid(ranger_workflow, resamples = coffee_resamples, grid = 11)
toc()#Tune function to find optimal paramethers
show_best(ranger_tune, metric = "rmse")
# A tibble: 5 × 8
mtry min_n .metric .estimator mean n std_err .config
<int> <int> <chr> <chr> <dbl> <int> <dbl> <chr>
1 14 8 rmse standard 0.148 5 0.00484 Preprocessor1_…
2 22 5 rmse standard 0.148 5 0.00491 Preprocessor1_…
3 26 22 rmse standard 0.149 5 0.00450 Preprocessor1_…
4 22 29 rmse standard 0.149 5 0.00442 Preprocessor1_…
5 17 32 rmse standard 0.149 5 0.00436 Preprocessor1_…
autoplot(ranger_tune) 
Results are consistent with the previous RMSE and model.
ranger_best <- ranger_workflow %>%
  finalize_workflow(select_best(ranger_tune, metric = "rmse"))

ranger_fit <- last_fit(ranger_best, coffee_split)
collect_metrics(ranger_fit)

# A tibble: 2 × 4
  .metric .estimator .estimate .config
  <chr>   <chr>          <dbl> <chr>
1 rmse    standard       0.162 Preprocessor1_Model1
2 rsq     standard       0.809 Preprocessor1_Model1
#According to this model, the following graph shows the most important variables.
ranger_fit %>%
ranger_fit %>%
extract_fit_engine() %>%
vi() %>%
mutate(Variable = fct_reorder(Variable, Importance)) %>%
ggplot(aes(x = Importance, y = Variable)) +
geom_col() +
scale_x_continuous(expand = c(0, 0)) +
labs(y = NULL) +
theme(legend.position = c(0.3, 0.3))Aftertaste looks very important for coffee experts, also acidity.

LASSO
A model trained using L1 norm is called Least Absolute Shrinkage and Selection Operator (LASSO). This model works well when datasets have many features, such as in this case.
Same procedure as before, specify the model, set engine, use Lambda penalty, workflow, tune, tic toc. Formula is: Lasso regression error = Regression error + L1 norm
lasso_spec <- linear_reg(penalty = tune(), mixture = 1) %>%
  set_engine("glmnet")


lasso_lambda_grid <- grid_regular(penalty(), levels = 50) #specify the amount of regularization to use (Silge & Kuhn, 2022)

lasso_workflow <- workflow() %>%
  add_recipe(coffee_rec) %>%
  add_model(lasso_spec)


tic()
lasso_tune <-
  tune_grid(
    lasso_workflow,
    resamples = coffee_resamples,
    grid = lasso_lambda_grid
  )
toc()

show_best(lasso_tune, metric = "rmse")

# A tibble: 5 × 7
   penalty .metric .estimator  mean     n std_err .config
     <dbl> <chr>   <chr>      <dbl> <int>   <dbl> <chr>
1 0.00222  rmse    standard   0.147     5 0.00335 Preprocessor1_Mod…
2 0.00139  rmse    standard   0.147     5 0.00328 Preprocessor1_Mod…
3 0.00356  rmse    standard   0.147     5 0.00331 Preprocessor1_Mod…
4 0.000869 rmse    standard   0.147     5 0.00322 Preprocessor1_Mod…
5 0.000543 rmse    standard   0.148     5 0.00318 Preprocessor1_Mod…
#RMSE and RSQ using LASSO
collect_metrics(lasso_tune) %>%
#filter(!is.na(std_err)) %>%
ggplot(aes(x = penalty, y = mean)) +
geom_line(size = 1, color = "brown") +
geom_point(color = "brown") +
geom_ribbon(aes(ymin = mean - std_err, ymax = mean + std_err),
alpha = 0.5, fill = "brown") +
facet_wrap(~.metric, ncol = 1, scales = "free_y") +
scale_x_log10()
For penalties below 1e-02 the models produce similar goodness-of-fit, but for penalties higher than 1e-02 the goodness of fit falls sharply.
lasso_best_workflow <- lasso_workflow %>%
  finalize_workflow(select_best(lasso_tune, metric = "rmse"))
lasso_fit <- last_fit(lasso_best_workflow, coffee_split)

collect_metrics(lasso_fit)

# A tibble: 2 × 4
  .metric .estimator .estimate .config
  <chr>   <chr>          <dbl> <chr>
1 rmse    standard       0.164 Preprocessor1_Model1
2 rsq     standard       0.803 Preprocessor1_Model1
LASSO Model results are similar to the ones obtained using Random Forest, and this model specifies some negative correlations: you can see them in red (Preprocessing Method Washed Wet, Color Bluish Green, Variety Typica, etc…).
Positive correlations in blue/green color: Aftertaste, Aroma, Acidity, Body, Clean cup, the partner called “In Country Partner Asociacion Del Café”, Balance, Guatemala, and Mexico as a country of origin, etc…
lasso_fit %>%
  extract_fit_engine() %>%
  vi(
    lambda =  select_best(lasso_tune, metric = "rmse")$penalty
  ) %>%
  mutate(Variable = fct_reorder(Variable, Importance)) %>%
  ggplot(aes(x = Importance, y = Variable, fill = Sign)) +
  geom_col() +
  scale_x_continuous(expand = c(0, 0)) +
  labs(y = NULL) +
  theme(legend.position = c(0.3, 0.3))
Results
The machine learning models applied here clearly point to Aftertaste as the single most important variable related to Flavor. Other important features are Aroma, Acidity, Body, and Balance. These rank highly in all models. Overall the three models are similar but Random Forest performs a bit better.
Conclusion
The analysis above focuses on coffee before it is roasted, brewed, and served to customers; then some quality experts taste coffee cups and rate them. Therefore, many other variables affect the ultimate cup that someone buys at a supermarket or drinks at a coffee shop. Local availability and price matter as well, of course, and customers’ decisions might be affected by marketing and trends. Even the skill of the barista preparing the coffee may play a key role in the final quality (SpecialCoffee, 2018). For Italians, for example, the preparation of an espresso cup is a ritual.
Expert coffee raters use common standards to assess the quality of coffee cups. Elements such as “Aftertaste”, “Aroma”, “Body”, “Clean Cup”, and “Balance”, are better with high values, while “Acidity” should not prevail over others. The importance of such variables is consistent with current trends, and many consumers now seek unique or original flavors. Gen Z customers, for example, are increasing the demand for cold coffee beverages, ready-to-drink coffee, and specialty coffees (ReportLinker, 2022).
According to the Lasso model, Guatemala and Mexico produce beans of high quality. The Lasso model identifies Asociacion Nacional del Café , from Guatemala, as a good choice. Since the dataset was collected between the years 2009 and 2018, we can evaluate this information with additional hindsight. Guatemalan coffee is considered a specialty for coffee aficionados because of its unique “sparkling acidity”(MacDonnell, 2019). The market for Guatemalan coffee bean varieties is expected to grow at a CAGR of 11.38% per annum in the next five years, but the growth is slowing down (Covid?) compared to the 18.43% per year growth registered in 2015-2019 (MarketResearch.com, 2020). According to table 5, other countries also rank high in terms of average cup points – e.g., Ethiopia, Ecuador, Japan, Panama, Papua New Guinea, United States, Kenya, Panama, and Uganda. While Japan is a surprise within this list, the United States also represents a special market, with its production mainly situated in Hawaii and California (Clayton, 2021). Table 5 specifies the results of Hawaii, Puerto Rico, and the remaining high result should be California. The famous Kona variety is grown in the 3 American areas, but this variety is sometimes mixed with other less expensive beans. However, its production is limited because of factors such as climate change and labor costs. Similarly, while the Blue Mountain variety grown in Papua New Guinea is highly esteemed, its production is also limited when compared to big players such as Brazil (Wisniowski, 2021).
And what about Ethiopia? Ethiopian Yirgacheffe is another variety with a distinctive taste. Gray defines it as “delicate, floral, and tea-like, with shimmery citrus notes and a clean, light body” (2021). The other variety produced in Ethiopia is called “Ethiopian” – it is more common and has an “unpredictable” quality. However, what makes the difference in terms of quality and flavor is the natural processing method. This information confirms the results of the analysis and explains why the model has negatively classified the “washed method.” The method of processing appears to matter, and the results from the LASSO model are similar to the patterns shown in the graph “Processing method compared to average cup points.” Coffee processed using the washed-wet method has lower cup points and less flavor. The average rating compared to the number of coffee bags checked from table 9 does not provide details about the quality, the model provides a different interpretation together with table 5.
Wordlpopulationreview (2022) has published a list of the world’s top coffee producers, with Brazil in the first place with a production of 5,714,381,000 pounds per year, compared to the 846,55,000 pounds Ethiopia produces (fifth place). Their table illustrates the gap between (a few) top players and the rest of the world, a sort of David and Goliath ratio.

Japan, Hawaii, Puerto Rico, and Californian coffee beans are not on the list.
The potential impact of this analysis, and limitations.
This analysis provides some practical information for identifying how the best coffee quality has been determined and evaluated. The same approach can be applied to many other types of food – e.g., chocolate or wheat – and can help buyers or companies when making decisions, for example in product development or to forecast customer trends.
As noted above, the dataset and corresponding analysis has limitations because it stops well short of the customer. It does not consider roasting, or the brewing methods used to prepare coffee (espresso machine, french press, Italian moca, cold press, etc…). These are relevant because they change depending on geographical areas. Therefore, coffee drinkers who are used to the same brewing methods might prefer some aromas, while espresso drinkers prioritize taste together with coffee foam.
Finally, the analysis is limited to arabica coffee because of issues with the robusta dataset (small N, and a different set of variables). This is important because – at least with regards to espresso – a mix of arabica and robusta varieties is necessary to obtain a really good cup of coffee.
References
Clayton, L. (2021, July 13). Does Coffee Grow In The United States? https://Sprudge.com. https://sprudge.com/coffee-basics-does-coffee-grow-in-the-united-states-179225.html
Coffee Quality Institute. (n.d.). ARABICA IN-COUNTRY PARTNERS. Database.coffeeinstitute.org. Retrieved November 23, 2022, from https://database.coffeeinstitute.org/users/icps/arabica
Coffeereview. (n.d.). Interpreting Coffee Reviews | CoffeeReview.com. Coffee Review.
https://www.coffeereview.com/interpret-coffee/
Dunn, T. (2020). TidyTuesday 2020 Week 28. Tdunn.ca. https://tdunn.ca/posts/2020-07-12-tidytuesday-2020-week-28/
LeDoux, J. (2022, January 28). coffee-quality-database. GitHub. https://github.com/jldbc/coffee-quality-database
Gray, M. (2021, March 25). Guide to Ethiopian Yirgacheffee Coffee | Bean Box®. Bean Box® – Coffee Gifts and Coffee Subscriptions. https://beanbox.com/blog/ethiopian-yirgacheffe-coffee#:~:text=Ethiopian%20Yirgacheffe%20is%20the%20coffee
Mock, T. (2020, July 6). rfordatascience/tidytuesday. GitHub.
https://github.com/rfordatascience/tidytuesday/blob/master/data/2020/2020-07-07/readme.md
Silge, J., & Kuhn, M. (2022). Tidy Modeling with R. In http://www.tmwr.org. https://www.tmwr.org/SpecialCoffee
The blending is an art – blog SpecialCoffee. SpecialCoffee. https://specialcoffeeitaly.com/blending-coffee-art/
Taylor, H. (2020, May 26). The Secrets of Japanese Coffee Culture. VOYAPON. https://voyapon.com/secrets-of-japanese-coffeeculture/#
Theobald, O. (2017). Machine learning for absolute beginners : a plain English introduction (pp. 1–162).
The Author.Wikipedia Contributors. (2019, November 7). List of highest mountains on Earth. Wikipedia; Wikimedia Foundation.
https://en.wikipedia.org/wiki/List_of_highest_mountains_on_earth
MarketResearch.com. (2020, October). Guatemala: Roast Coffee Market and the Impact of COVID-19 on It in the Medium Term. http://Www.marketresearch.com. https://www.marketresearch.com/Williams-Marshall-Strategy-v4196/Guatemala-Roast-Coffee-Impact-COVID-13621894/
MacDonnell, K. (2019, October 6). 5 Best Guatemalan Coffee Brands 2022 — Top Picks & Guide. Coffee Affection. https://coffeeaffection.com/best-guatemalan-coffee-brands/
ReportLinker. (2022, October 10). Global Coffee Market: Analysis By Product Type, By Coffee Bean Type, By Region Size and Trends with Impact of COVID-19 and Forecast up to 2027. GlobeNewswire News Room. https://www.globenewswire.com/news-release/2022/10/10/2530828/0/en/Global-Coffee-Market-Analysis-By-Product-Type-By-Coffee-Bean-Type-By-Region-Size-and-Trends-with-Impact-of-COVID-19-and-Forecast-up-to-2027.html
SpecialCoffee. (2018, February 20). Barista’s skills for the perfect espresso – blog SpecialCoffee. SpecialCoffee. https://specialcoffeeitaly.com/barista-skills-for-perfect-espresso/
Wisniowski, J. (2021, October 11). Papua New Guinea Coffee: Flavors, History, and Brewing Tips. Coffee Affection. https://coffeeaffection.com/papua-new-guinea-coffee-guide/#:~:text=Coffee%20Bean%20Type&text=Around%2095%25%20of%20coffee%20from
Wordlpopulationreview. (2022). Coffee Producing Countries 2021. Worldpopulationreview.com. https://worldpopulationreview.com/country-rankings/coffee-producing-countries
Full script is available on my GitHub profile.
Appendix
Data Dictionary
data dictionary by Mock (2020).
total_cup_points= Total rating/points (0 – 100 scale)
species character= Species of coffee bean (arabica* or robusta)
owner character= Owner of the farm
country_of_origin= Where the bean came from
farm_name= Name of the farm
lot_number= Lot number of the beans tested
mill= Mill where the beans were processed
ico_number= International Coffee Organization number
company= Company name
altitude = Altitude
region= Region where beans came from
producer= Producer of the roasted bean
number_of_bags= Number of bags tested
bag_weight= Bag weight tested
in_country_partner= Partner for the country
harvest_year= When the beans were harvested (year)
grading_date= When the beans were graded
owner_1= Who owns the beans
variety= Variety of the beans
processing_method= Method for processing
aroma= Aroma grade
flavor= Flavor grade
aftertaste= Aftertaste grade
acidity= Acidity grade
body= Body grade
balance= Balance grade
uniformity= Uniformity grade11/14/22, 11:05 AM Coffee Quality
file:///C:/Users/Mirna/Dropbox/CAPSTONE_CHOOSE YOUR OWN/Coffee-Quality.html 2/40
clean_cup= Clean cup grade
sweetness= Sweetness grade
cupper_points= Cupper Points
moisture= Moisture Grade
category_one_defects= Category one defects (count)
quakers = quakers
color= Color of bean
category_two_defects= Category two defects (count)
expiration= Expiration date of the beans
certification_body= Who certified it
certification_address= Certification body address
certification_contact= Certification contact
unit_of_measurement= Unit of measurement
altitude_low_meters= Altitude low meters
altitude_high_meters= Altitude high meters
altitude_mean_meters double Altitude mean meters


Leave a comment